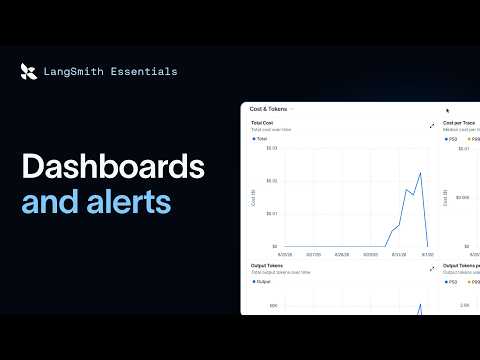
Dashboards and Alerts | Introduction to LangSmith (10/12)

Video thumbnail: Dashboards and Alerts | Introduction to LangSmith (10/12)
Nov 17, 20262m 42s video lengthLangChain

The Signal

This video tutorial introduces a monitoring workflow for tracing projects, distinguishing active manual investigation from ongoing aggregate oversight. It walks through prebuilt dashboard configurations and custom threshold alerts, framing these features as the next logical step after identifying specific issues. The tutorial provides detailed UI settings, though these remain unverified product assertions.

The Case

Discovery vs. Monitoring

  • The narrator frames current monitoring features as a transition from prior discovery, asserting that all previous findings required manual queue searching and targeted Insights jobs.
  • Dashboards are presented as a means to track aggregate system behavior over time, while alerts serve to notify users when configured thresholds are breached.0:12

Dashboard Capabilities

  • Every tracing project is said to feature a prebuilt dashboard containing six specific tabs: traces, LLM calls, cost and tokens, tools, run types, and feedback scores.0:34
  • Custom dashboards allow users to name metrics and select visualizations, such as a line chart tracking the average of a sentiment feedback key.1:25
  • A group-by control is available to split charts by metadata tags, though Tools and Run Types tabs are excluded because they handle their own internal grouping.

Alert Configuration

  • Users can trigger notifications—via Slack, PagerDuty, Dynatrace, or webhooks—based on five specific metrics: run count, cost, errors, feedback score, or latency.2:01
  • A provided example alert is configured for an average sentiment feedback score falling below 0.8 within a 5-minute aggregation window.2:18
  • The tutorial describes this setup but provides no evidence that the example alert was ever saved, triggered, or successfully delivered.

The 1 Minute Signal Take

The video serves as a specific interface walkthrough that details available monitoring hooks and configuration logic. Viewers should note that while the tutorial describes these features as universal, the transcript contains no independent verification that these dashboards behave consistently across all projects.

Pro Analysis

Why It Matters

The transition from reactive debugging to proactive monitoring is the defining line between a prototype and a production-grade LLM application. By formalizing 'Monitor' as a distinct workflow stage, the platform encourages developers to treat system performance as a continuous, metric-driven process rather than a fire-fighting exercise.

Strategic Implications

Teams that successfully adopt automated alerting reduce their 'mean time to detection' (MTTD). By tying alerts to semantic indicators like user feedback rather than just system uptime, developers align their technical monitoring with real-world user satisfaction.

Evidence & Hype Audit

This content is a standard product walkthrough rather than a research paper. It is highly specific regarding UI capabilities (e.g., specific metrics and tab labels) but lacks an empirical data-backed argument on whether these monitoring features improve system outcomes. The narrator is inherently promoting the platform; therefore, the 'how-to' is reliable for interface navigation but untested regarding effectiveness.

Counterarguments

Critics might argue that over-reliance on dashboarding creates 'alert fatigue.' Focusing on granular threshold alerts can sometimes mask broader architectural issues that aren't captured by simple average-based metrics. A purely reactive system might miss systemic trends that don't trigger a hard threshold.

Who Should Care

  • LLM Engineers: To automate performance tracking and establish baseline latency expectations.
  • Product Managers: To gain visibility into user sentiment trends through feedback dashboards.
  • SREs: To configure critical path alerts that tie system health directly to incident response tools.

What to Do Next

  • Review current project dashboards to identify which of the six prebuilt tabs provides the most relevant data for your current bottleneck.
  • Define at least one threshold-based alert based on a key business metric, such as error rate or sentiment.
  • Integrate your project's alert system with an existing communication channel like Slack or PagerDuty.
  • Create a custom dashboard tailored to the specific metadata fields that define your application's success.
  • Investigate how 'run types' and 'tools' tabs can isolate the impact of specific dependencies within your chains.

Share this

Tags

Written by: 1 Minute Signal Editorial Team